Sample reports
When a sample job status is Complete the sample reports are created which sets out how successful the Job Queue sampling was when applied to the database of panellists. There are two reports available:
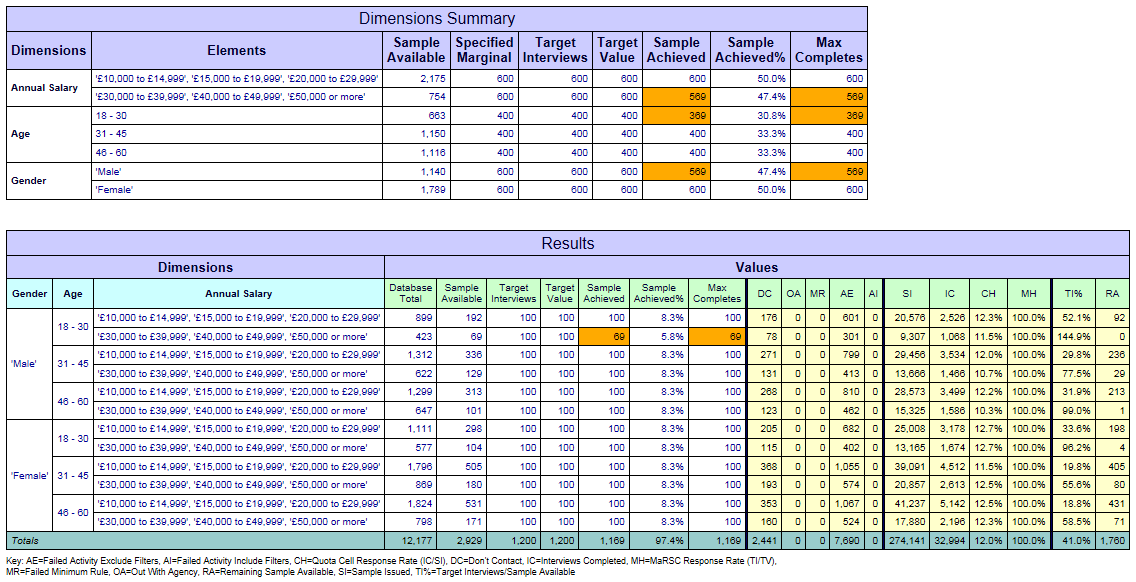
- The Sample report provides details of shortfalls in the sample. It also lists the profile and activity filters used to generate the sample, and shows the detail of the activity filters used.
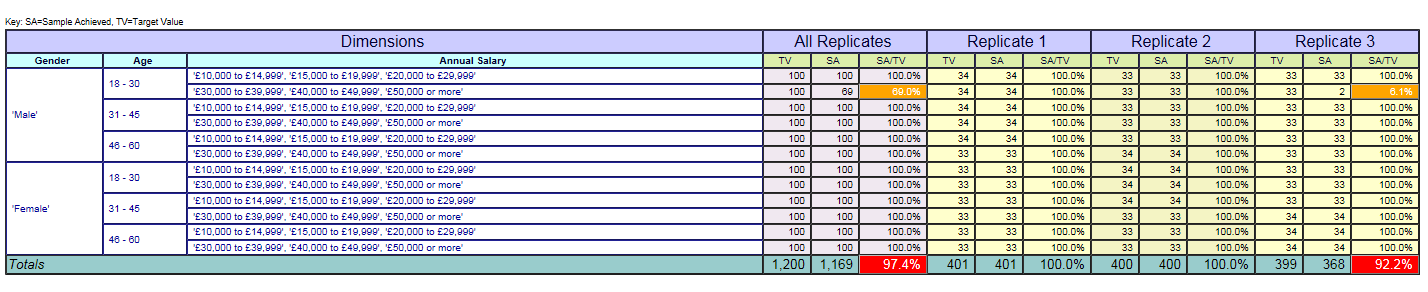
- The Replicates report provides details of the replicate batches with a breakdown of the sample achieved per quota cell for each batch.
View the Sample Report
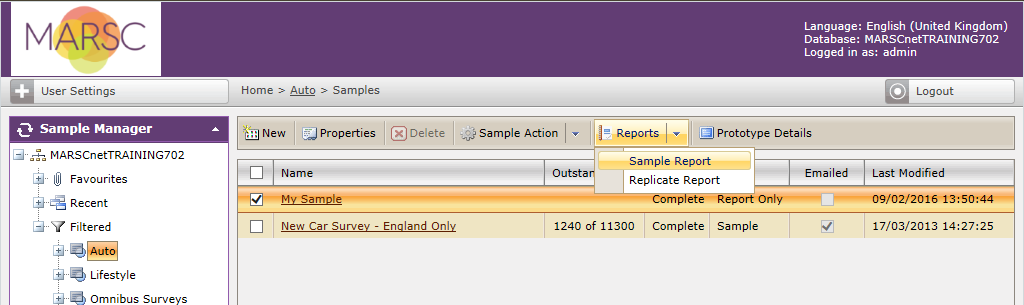
Click on the prototype in the navigation pane to bring up the Samples list and tick the checkbox next to the sample.
Click the Reports menu dropdown in the toolbar and select Sample Report.
This opens the Report Viewer which allows you to see and print the sample report:


By default the Job Queue will save a copy of the report in the folder, this may be configured to use a different location.
C:\Program Files\MaRSC\Windows\HTMLReport.
Column abbreviations
| Abbr | Stands for | Description |
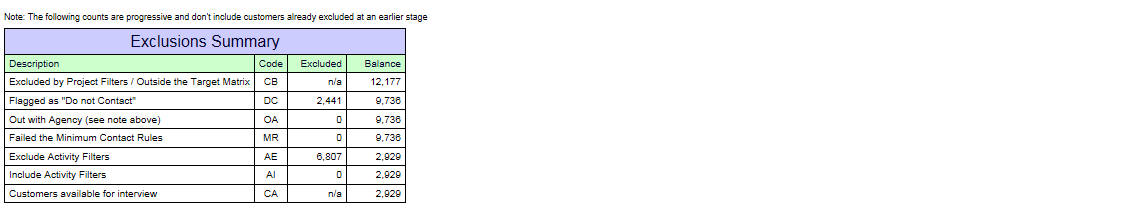
| CB | Database Total ( alias Customers Before filtering) | Total number of panellists for that cell present in the database. |
| CA | Sample Available ( alias Customers Available) | Total number of panellists available for sample. CA=CB – any in (DC, OA, MR, AE, AI) |
| TI | Target Interviews | Target number of interviews per cell as calculated from the user’s specification |
| TV | Target Value (or Volume) | TV=TI/(MH*IR) Sample required after taking into account response & incidence rates. |
| SA | Sample Achieved | Sample Achieved – i.e. the number of panellists available to supply. |
| SA% | Sample Achieved % | [Sample Achieved] / (Sum of [Target Value]) |
| n/a | Max Completes | The number of completes achievable when the target cannot be hit. Sample Available * Incidence Rate * Response Rate (MH) |
The next columns are the filters:
| Abbr | Stands for | Description |
| DC | Don't Contact | Individual has been set to don’t contact (either permanently or temporarily). Usually 0 |
| OA | Out With Agency (or in the Field) | Always 0 |
| MR | Minimum Rule | Always 0 |
| AE | Activity Excluded | Panellists excluded by all the Exclude Activity Filters |
| AI | Activity Included | Panellists excluded by all the Include Activity Filters (= those NOT included) |
The next three columns display data used to calculate the Response-rate % value (MH):
| SI | Sample Issued | Number of sample units previously issued for this quota cell (for which we know the interview outcome). |
| IC | Interviews Completed ( alias Interview Count) | The number of successful interviews from the Sample Issued. |
| CH | Cell Response Rate | CH = IC/SI % |
| MH | Response Rate | When Per Cell is selected providing SI is greater (or equal) to 50 then MH will be set to CH. Otherwise MH will be set to the user’s specified Response Rate % |
| TI% | Target Interviews/Sample Available | TI% = Target Interviews/Sample Available% Target Interviews as a percentage of the panellists available |
| RA | Remaining Available | Remaining sample available in the database. |
Note that by default, the Response Rate calculation does not include activity filters applied to the sample job. To include activity filters in the calculation, the following setting can be added to marsc.cfg:
<RestrictResponseRateByActivityFilters>1</RestrictResponseRateByActivityFilters>
Resolve shortfalls
The cells highlighted in orange in the Sample Report tables show that there are shortfalls: SampleAchieved does not match TargetValue.
The Results table locates in detail where the shortfalls are in the quota cells. This table displays a breakdown of the sample availability calculated for the cells in the target matrix.
We need to resolve the shortfall found with the interlocking cell definitions used to date.
In our example, the Total Sample Achieved is less than the Total Target Value. We have a shortfall in several interlocking quota cells. Looking at the Dimensions Summary this has the effect of compromising the dimensions: Gender, Age and Annual Salary.
The '£30,000 to £39,999', '£40,000 to £49,999', '£50,000 or more' Salary group is unable to supply the total sample requirement -- it has all been taken and it is still not enough. However there is capacity in the other dimensions to satisfy the requirement there. There is scope for Sample Manager to re-distribute sample so as to improve the match to the dimensions specified, by selecting a non-interlocking algorithm.
In this case you might decide to try changing your sample project’s dimensions type to Non-interlocking and re-submit it. You can make as many changes and re-submissions as you wish as long as the sample project has the Report Only option checked.
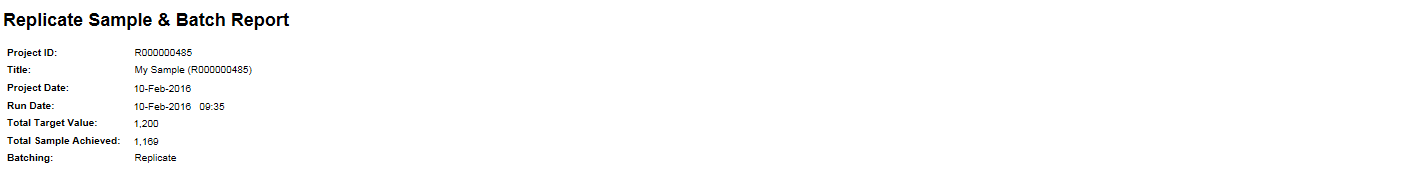
View the Replicates Report
Click on the prototype in the navigation pane to bring up the Samples list and tick the checkbox next to the sample.
Click the Reports menu dropdown in the toolbar and select Replicate Report.

This opens the Report Viewer which allows you to see and print the replicate report: